
April 2017 /
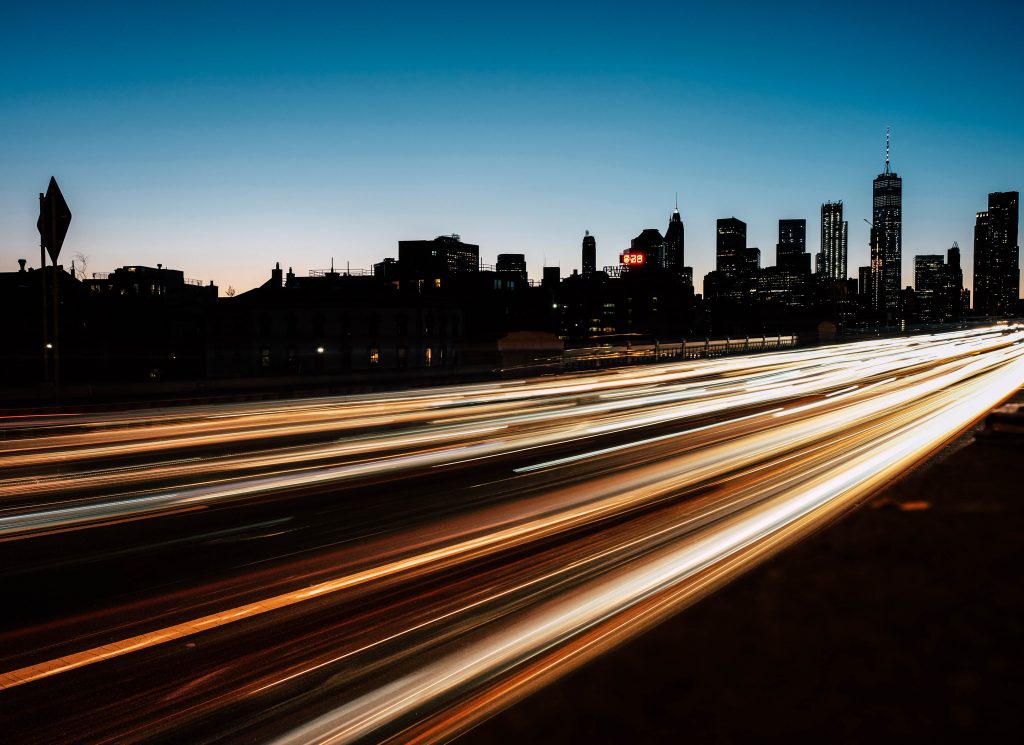
In this issue I want to turn away from global considerations and start looking closer to home at New York City’s energy infrastructure. I’ve often wondered where the electricity comes from which charges my cellphone. Deep in the recesses of my memory I remember a faint reference in an elementary school class to a power grid covering North America. This grid is relatively idle in spots during the year, only reaching maximum capacity during the “dog days” of August. This transmission system was initially designed well before the advent of the technological revolution, and like Norma Desmond in “Sunset Boulevard,” its age is steadfastly creeping up on it, with around 6,000 miles of transmission lines needing to be replaced at an estimated cost of more than $30 billion. This would be an infrastructure project of major proportions.
In the latter portion of the nineteenth century, coal was used to power the machinery, which manufactured electricity for residences in Lower Manhattan. But as we all know from the recent 2016 presidential election, coal is definitely on the way out. Coal-fired plants in New York State are to be closed or converted to natural gas. Statistically, about 60-odd plants of which use natural gas produced around one-half of the electricity in the state. Nuclear accounts for another third of the electricity production-but this percentage may decrease with Governor Cuomo’s decision to close the Indian Point Power Plant in Westchester County.
Other contributors include more than one hundred hydroelectric plants, which produce around one-fifth of the state’s electricity.
Legislators want to set a goal of having around half of the electricity used in the state to come from renewable sources by the year 2030. Right now less than 25 percent of electricity produced in New York State comes from renewable sources. As for solar and wind farms they are not considered more than curiosities in the hunt for non-polluting energy sources. This entire system was constructed to respond to a worst case scenario such as in August when demand is at its peak. During the rest of the year electricity manufacturing plants are not used to capacity.
Deep in the recesses of my memory I remember a faint reference in an elementary school class to a power grid covering North America.
All of this in-state power generation is monitored by the New York Independent System Operator ( NYISO ) which is based in Albany, and which is tasked with monitoring electricity flowing through New York State’s grid to other grids. NYISO oversees something called the Eastern Interconnection, which is one of the country’s three main grids, jointly providing coverage all the way to the Rocky Mountains. Without NYISO doing its job we would be vulnerable to blackouts like the one that occurred in 2003 which affected about 40 million electricity consumers, costing the U.S. economy incalculable economic damage.
What is at the core of New York’s system? High-voltage lines. Approximately 10,000 miles of them both overhead and underground carry electricity to local utilities. It is interesting to note that around 55 percent of the state’s electricity is consumed in the New York City area, but only 45 percent of it is actually made in the New York City area.
The lead utility in our region, Con Edison services over 500 square miles of the City plus Westchester County. It continuously upgrades its system with energy-efficient enhancements, with the cost borne by the consumer — a typical New York City resident can expect an $70 per month electric bill when the enhancements are all in place.
For the future we can expect to see a reduction in energy use due to more efficient appliances and more comprehensive insulation of buildings, the inverse of that, however, will be an increase in peak demand as air conditioning installations continue to increase across the City’s housing stock.
Some Practical Considerations
How to read your Con Ed bill-first please note that Con Ed’s rates for New York City were second only to Hawaii which are the most expensive in the U.S. Now for the Con Ed bill itself-approximately 50% reflects what your provider paid for the electricity on various wholesale markets, which are administered by our friends at NYISO. Another 40% of your bill represents fees and taxes; the balance is for Delivery and Transmission costs.
Lastly, you may be approached by an energy service company or ESCO who wants to sell you energy. These ESCOS buy electricity in the wholesale markets and deliver it to you through a local utility. Tread carefully here or at the very least reach out to your trusted energy advisor for guidance.
Ron Spurga
United Metro Energy Corporation
P: 718-383-1400
C: 347-406-1389
ron@umecny.com